


 Account
 Help?
Help?
PLEASE MATCH YOUR ASSIGNMENT QUESTIONS ACCORDING TO YOUR SESSION
IGNOU MST-17 (June 2024 – June 2025) Assignment Questions
1(a) State whether the following statements are true or false and also give the reason in support of your answer.
(i) We define three indicator variables for an explanatory variable with three categories.
(ii) If the coefficient of determination is 0.833, the number of observations and explanatory variables are 12 and 3, respectively, then the Adjusted R2 will be 0.84.
(iii) For a simple regression model fitted on 15 observations, if we have hii = 0.37, then it is an indication to trace the leverage point in the regression model.
(iv) In a regression model
Y = β0 + β1X1 + β2X2 + ε, if H0: β1 = 0 is not rejected, then
the variable X1 will remain in the model.
(v) The logit link function is log [−log(1 − π)].
(b) Write a short note on the problem of multicollinearity and autocorrelation.
2(a) Explain the assumptions underlying multiple linear regression model.
(b) Suppose a researcher wants to evaluate the effect of cholesterol on the blood pressure. The following data on serum cholesterol (in mg/dL) and systolic blood pressure (in mm/Hg) were obtained for 15 patients to explore the relationship between cholesterol and blood pressure:
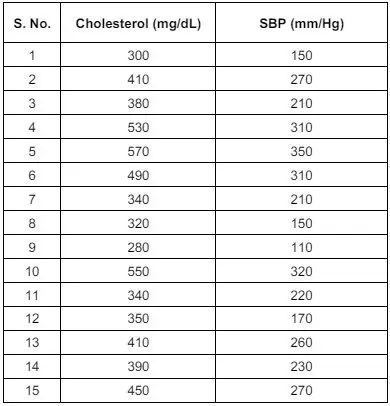
(i) Fit a linear regression model using the method of least squares.
(ii) Construct the normal probability plot for the regression model fitted on serum cholesterol and systolic blood pressure.
(iii) Test the significance of the fitted regression model.
3. For the data given in Question 2(b), obtain the followings:
(i) Diagonal of the hat matrix and also check the leverage points if any.
(ii) Cook’s Distances, DFFITS and DFBETAS. Also verify the influence points if any.
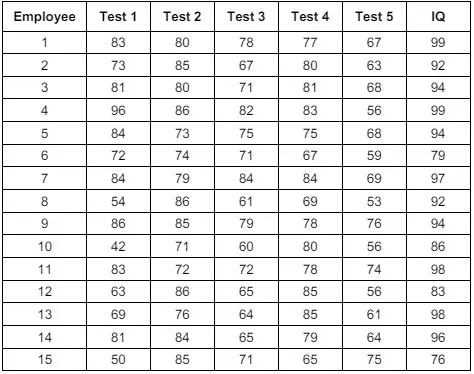
4 A company conducted a study on its employees to see the relationship of several variables with an employ’s IQ. For this purpose, fifteen employees were selected and an IQ as well as five different personality tests were given to them. Each employ’s IQ was recorded along with scores on five tests. The data are shown in the following table:
Determine the most appropriate regression model for the employee’s IQ using stepwise approach at 5 % level of significance and interpret the results. Does the final regression model satisfy the linearity and normality assumptions?
5. The following data on diagnosis of coronary heart disease (where 0 indicating absence and 1 indicating presence), serum cholesterol (in mg/dl), resting blood pressure (in mmHg) and weight (in kg) were obtained for 80 patients to explore the relationship of coronary heart disease with cholesterol and weight:

(i) Fit a multiple logistic model for the dependence of coronary heart disease on the average serum cholesterol and weight considering ![]() as
as
the initial values of the parameters (solve only for one Iteration).
(ii) Test the significance of the fitted model using Hosmer-Lemeshow test at 5% level of significance.
IGNOU MST-17 (January 2024 – December 2024) Assignment Questions
1(a) State whether the following statements are true or false and also give the reason in support of your answer.
(i) We define three indicator variables for an explanatory variable with three categories.
(ii) If the coefficient of determination is 0.833, the number of observations and explanatory variables are 12 and 3, respectively, then the Adjusted R2 will be 0.84.
(iii) For a simple regression model fitted on 15 observations, if we have hii = 0.37, then it is an indication to trace the leverage point in the regression model.
(iv) In a regression model
Y = β0 + β1X1 + β2X2 + ε, if H0: β1 = 0 is not rejected, then
the variable X1 will remain in the model.
(v) The logit link function is log [−log(1 − π)].
(b) Write a short note on the problem of multicollinearity and autocorrelation.
2(a) Explain the assumptions underlying multiple linear regression model.
(b) Suppose a researcher wants to evaluate the effect of cholesterol on the blood pressure. The following data on serum cholesterol (in mg/dL) and systolic blood pressure (in mm/Hg) were obtained for 15 patients to explore the relationship between cholesterol and blood pressure:
(i) Fit a linear regression model using the method of least squares.
(ii) Construct the normal probability plot for the regression model fitted on serum cholesterol and systolic blood pressure.
(iii) Test the significance of the fitted regression model.
3. For the data given in Question 2(b), obtain the followings:
(i) Diagonal of the hat matrix and also check the leverage points if any.
(ii) Cook’s Distances, DFFITS and DFBETAS. Also verify the influence points if any.
4 A company conducted a study on its employees to see the relationship of several variables with an employ’s IQ. For this purpose, fifteen employees were selected and an IQ as well as five different personality tests were given to them. Each employ’s IQ was recorded along with scores on five tests. The data are shown in the following table:
Determine the most appropriate regression model for the employee’s IQ using stepwise approach at 5 % level of significance and interpret the results. Does the final regression model satisfy the linearity and normality assumptions?
5. The following data on diagnosis of coronary heart disease (where 0 indicating absence and 1 indicating presence), serum cholesterol (in mg/dl), resting blood pressure (in mmHg) and weight (in kg) were obtained for 80 patients to explore the relationship of coronary heart disease with cholesterol and weight:
(i) Fit a multiple logistic model for the dependence of coronary heart disease on the average serum cholesterol and weight considering ![]() as
as
the initial values of the parameters (solve only for one Iteration).
(ii) Test the significance of the fitted model using Hosmer-Lemeshow test at 5% level of significance.