IGNOU MSTE-01 Industrial Statistics-I - IGNOU Solved Assignment (Latest)
Get IGNOU MSTE-01 Assignments Soft Copy ready for Download in PDF for (January 2024 – December 2024) in English Language.
- Helps save time and effort-really well
- Promises Good Marks in Less Time
- Answers that are verified and accurate
- Based on IGNOU Guidelines.
- Description
- Previous Year Solved Question Papers Included
- Assignments Details
- Assignment Submission End Date
- What's Included
PLEASE MATCH YOUR ASSIGNMENT QUESTIONS ACCORDING TO YOUR SESSION
IGNOU MSTE-01 (January 2024 – December 2024) Assignment Questions
1. State whether the following statements are True or False. Give reason in support of your answer.
a) If the average number of defects in an item is 4, the upper control limit of the c-chart will be
b) The specification limits and natural tolerance limits are same in statistical quality control.
c) If the probability of making a decision about acceptance or rejection of a lot on the first sample is 0.80 and the sizes of the first and second samples are 10 and 15, respectively, then the average sample number for the double sampling plan will be 25.
d) Two independent components of a system are connected in series configuration. If the reliabilities of these components are 0.1 and 0.30, respectively then the reliability of the system will be 0.65.
e) A point in the pictorial representation of a decision tree having states of nature as immediate sub-branches is known as decision point.
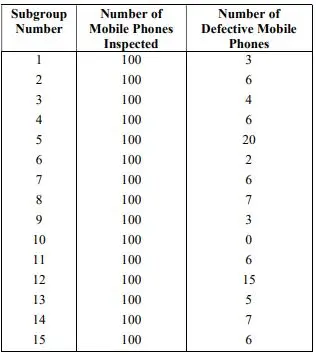
2. To monitor the manufacturing process of mobile phones, a quality controller randomly selected 100 mobile phones from the production line, each day over 15 days. The mobile phones were inspected for defectives and the number of defective mobile phones found each day was recorded. The data are given below:
i) Determine the trial centre line and control limits for the fraction defective using the above data.
ii) Contract the control chart on graph paper and determine that the process is stable or not. If there is any out-of-control point, determine the revised centre line and control limits.
3. A shirt manufacturing company supplies shirts in lots of size 250 to the buyer. A single sampling plan with n = 20 and c = 1 is being used for the lot inspection. The company and the buyer decide that AQL = 0.04 and LTPD = 0.10. If there are 15 defective in each lot, compute the
i) probability of accepting the lot.
ii) producer’s risk and consumer’s risk.
iii) average outgoing quality (AOQ), if the rejected lots are screened and all defective shirts are replaced by non-defectives.
iv) average total inspection (ATI).
4. The failure density function of a random variable T is given by
Calculate, the
i) reliability of the component.
ii) reliability of the component for a 100 hour mission time.
iii) mean time to failure (MTTF).
iv) median of the random variable T.
v) life of the component, if the reliability of 0.96 is desired.
5. Solve the two-person zero-sum game having the following payoff matrix for player A:
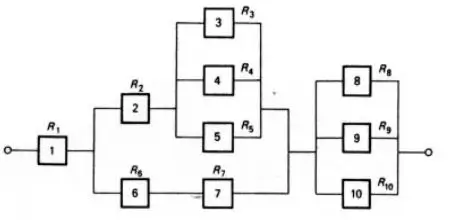
6. The system shown below is made up of ten components. Components 3, 4 and 5 are not identical and at least one component of this group must be available for system success. Components 8, 9 and 10 are identical and for this particular group it is necessary that two out of the three components functions.
What is the system reliability if R1 = R3 = R5 = R7 = R9 = 0.85 and R2 = R4 = R6 = R8 = R10 = 0.95
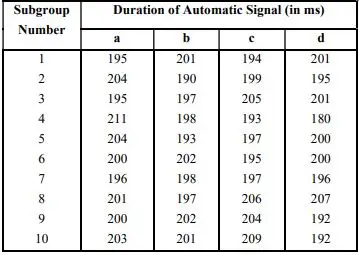
7. A small electronic device is designed to emit a timing signal of 200 milliseconds (ms) duration. In the production of this device, 10 subgroups of four units are taken at periodic intervals and tested. The results are shown in the following table:
i) Estimate the process mean and standard deviation.
ii) Determine the centre line and control limits for the process mean and process variability.
iii) By plotting the charts on graph paper, determine that the process is stable or not with respect to the process mean and process variability. If necessary, compute revised control limits.
8. The failure data of 10 electronic components are shown in the table given below:
Estimate, the
i) reliability.
ii) cumulative failure distribution.
iii) failure density.
iv) failure rate functions.
IGNOU MSTE-01 (January 2023 – December 2023) Assignment Questions
1. State whether the following statements are True or False. Give reason in support of your answer.
a) If the average number of defects in an item is 4, the upper control limit of the c-chart will be
b) The specification limits and natural tolerance limits are same in statistical quality control.
c) If the probability of making a decision about acceptance or rejection of a lot on the first sample is 0.80 and the sizes of the first and second samples are 10 and 15, respectively, then the average sample number for the double sampling plan will be 25.
d) Two independent components of a system are connected in series configuration. If the reliabilities of these components are 0.1 and 0.30, respectively then the reliability of the system will be 0.65.
e) A point in the pictorial representation of a decision tree having states of nature as immediate sub-branches is known as decision point.
2. To monitor the manufacturing process of mobile phones, a quality controller randomly selected 100 mobile phones from the production line, each day over 15 days. The mobile phones were inspected for defectives and the number of defective mobile phones found each day was recorded. The data are given below:
i) Determine the trial centre line and control limits for the fraction defective using the above data.
ii) Contract the control chart on graph paper and determine that the process is stable or not. If there is any out-of-control point, determine the revised centre line and control limits.
3. A shirt manufacturing company supplies shirts in lots of size 250 to the buyer. A single sampling plan with n = 20 and c = 1 is being used for the lot inspection. The company and the buyer decide that AQL = 0.04 and LTPD = 0.10. If there are 15 defective in each lot, compute the
i) probability of accepting the lot.
ii) producer’s risk and consumer’s risk.
iii) average outgoing quality (AOQ), if the rejected lots are screened and all defective shirts are replaced by non-defectives.
iv) average total inspection (ATI).
4. The failure density function of a random variable T is given by
Calculate, the
i) reliability of the component.
ii) reliability of the component for a 100 hour mission time.
iii) mean time to failure (MTTF).
iv) median of the random variable T.
v) life of the component, if the reliability of 0.96 is desired.
5. Solve the two-person zero-sum game having the following payoff matrix for player A:
6. The system shown below is made up of ten components. Components 3, 4 and 5 are not identical and at least one component of this group must be available for system success. Components 8, 9 and 10 are identical and for this particular group it is necessary that two out of the three components functions.
What is the system reliability if R1 = R3 = R5 = R7 = R9 = 0.85 and R2 = R4 = R6 = R8 = R10 = 0.95
7. A small electronic device is designed to emit a timing signal of 200 milliseconds (ms) duration. In the production of this device, 10 subgroups of four units are taken at periodic intervals and tested. The results are shown in the following table:
i) Estimate the process mean and standard deviation.
ii) Determine the centre line and control limits for the process mean and process variability.
iii) By plotting the charts on graph paper, determine that the process is stable or not with respect to the process mean and process variability. If necessary, compute revised control limits.
8. The failure data of 10 electronic components are shown in the table given below:
Estimate, the
i) reliability.
ii) cumulative failure distribution.
iii) failure density.
iv) failure rate functions.
MSTE-01 Assignments Details
| University | : | IGNOU (Indira Gandhi National Open University) |
| Title | : | Industrial Statistics-I |
| Language(s) | : | English |
| Code | : | MSTE-01 |
| Degree | : | |
| Subject | : | Applied Statistics |
| Course | : | Specialization Course |
| Author | : | Gullybaba.com Panel |
| Publisher | : | Gullybaba Publishing House Pvt. Ltd. |


