


 Account
 Help?
Help?
PLEASE MATCH YOUR ASSIGNMENT QUESTIONS ACCORDING TO YOUR SESSION
IGNOU MCSL-229 (January 2024 – July 2024) Assignment Questions
PART-I: Cloud Computing Lab
Q1: (a) Use Google Docs to create your Curriculum Vitae document. Store it on Google Drive and share it with two friends who can view and comment on it.
(b) Use Google Sheets and create a spreadsheet containing the marks of 10 students under the headings – student name, phone, and marks out of 100 in 5 different subjects. Find the students’ grades in each subject using the formula below. Also, compute the Cumulative Grade Point Average for each student.
Cumulative Grade Point Average = Average of Grade Points of all the subjects.
Grade Points: A-5; B-4; C-3; D-4; E-1.
The Grades are computed as:
If marks >= 75 Grade = A;
If marks <75 and marks >= 60 Grade = B;
If marks <60 and marks >= 50 Grade = C;
If marks <50 and marks >= 40 Grade = D;
If marks <40 Grade = E;
(c) Use Google Slides and prepare nine slides on the topic “Software as a Service (SaaS)” in a group of three students by sharing the Google Slides in your group in edit mode. Every group member should make three slides each and contribute to the slides of other members of her/his group.
Q2: Write the steps of installing Oracle Virtual Box on a laptop. Also, describe the features of the Oracle Virtual Box.
Q3: Use Google App Engine and write a Google app engine program to validate users using username and password and deploy it to Google Cloud.
PART-II: Data Science Lab
Q4: The weights of 50 adults aged 20-35 years, measured in Kilograms, are given below. Perform the tasks (i) to (iv) using R programming.
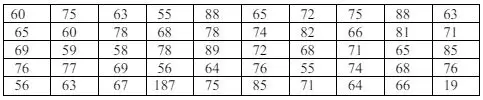
(i) Find the minimum and maximum weight.
(ii) Find the percentage of adults whose weight is between 65 and 75 Kilograms.
(iii)Create and draw the frequency distribution with the help of a relevant graph.
(iv)Find the outlier of the data.
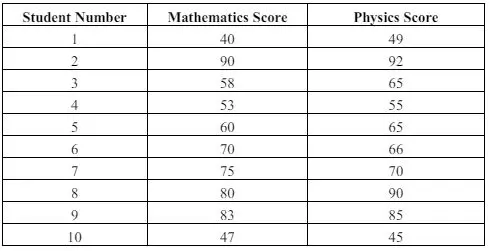
Q5: The following data were collected on students’ Mathematics and Physics scores. Use R programming to fit a linear regression line to predict the effect of Mathematics scores on the Physics scores of a student. Also, predict the Physics score of a student whose Mathematics score is 80.
IGNOU MCSL-229 (January 2023 – July 2023) Assignment Questions
PART-I: Cloud Computing Lab
Q1. (a) Use Google Docs and create a word document of your completed projects and achievements of the last year and store it on Google Drive and provide permission to view the document. Share this document with any two hypothetical employing agencies.
(b) Use Google Sheets and create a spreadsheet which contains yearly details of the monthly salaries of 10 different employees in the heading – gross pay, provident fund deductions, income tax deduction and net salary. Find the total tax deducted from the salary of each employee. Also, compute total tax deduction based on yearly Gross Salary and provident fund deductions as per the formula given below. Find the tax due or refund for each employee from this data.
Yearly Salary = Yearly Gross Salary – (2,00,000 or Total Provident fund deduction whichever is low.)
Yearly tax computation:
If yearly salary < 5 lakhs No tax
If yearly salary >= 5 lakhs but < 10 lakhs, then
Tax is 20% on salary above 5 lakhs
If yearly salary > 10 lakhs, then
Tax is (1 lakh + 40% on salary above 10 lakhs)
(c) Use Google Slides and prepare 9 slides on the topic “Cloud Architectures” in a group of 3 students each by sharing the Google Slides in your group in edit mode. Every group member should make three slides each and contribute to the slides of other group members.
Q2. Create a list of cloud services provided by AWS. List the steps to set up an Elastic Compute Cloud (EC2) instance. Do these services lower the cost of operation of an organisation? Justify your answer.
Q3. Use Google App Engine to write a Google app engine program to generate prime numbers up to a number given number n and deploy it to Google cloud.
PART-II: Data Science Lab
Q1. The height of 50 adults in the age group 30-40 years, measured in centimetres, is given below. Perform the tasks given in (i) to (iii) using R programming

(i) Find the minimum and maximum height.
(ii) Find the percentage of adults, whose height is in between 160 and 170 centimetres.
(iii)Create and draw the frequency distribution with the help of a relevant graph.
Q2. The following data were collected on the height and weight of 16 students. Use R programming to fit a linear regression line to predict the effect of height on the weight of a student. Also, predict the weight of the student whose height is 160 centimetres: