


 Account
 Help?
Help?
PLEASE MATCH YOUR ASSIGNMENT QUESTIONS ACCORDING TO YOUR SESSION
IGNOU MST-13 (June 2024 – June 2025) Assignment Questions
1. State whether the following statements are true or false and also give the reason in support of your answer:
(a) ![]()
(b) The total number of all possible samples of size 3 without replacement from a population of size 7 is 21.
(c) While analysing the data of a 5 × 5 Latin Square design the d.f. for ESS is equal to 16.
(d) In a Two-way Analysis of Variance test with 5 observations per cell having 4 blocks and 4 treatments the degree of freedom for the total variation is 64.
(e) The probability of selection of a sample of n from the population by SRSWOR is 1/ N.
2(a) A sample of 100 employees is to be drawn from a population of collages A and B. The population means and population mean squares of their monthly wages are given below:
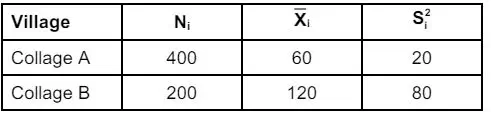
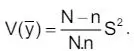
Draw the samples using Proportional and Neyman allocation techniques and compare. Obtain the sample mean and variances for the Proportional Allocation and SRSWOR for the given information. Then Find the percentage gain in precision of variances of sample mean under the Proportional Allocation over the that of SRSWOR.
(b) A population consists of 10 villages with a total of 212 households. The second column of the accompanying table shows the number of households corresponding to each village. Select a PPS with replacement sample of 6 villages by using the Cumulative Total method:

3(a) In a population of size N = 5, the values of the population characteristics are 1, 3, 5, 7, 9, a sample of size 2 is drawn. Verify that ![]() is an unbiased estimate of
is an unbiased estimate of ![]() is equal to
is equal to
(b) In order to compare the mileage yields of 3 kinds of Gasoline, several tests were run, and the following results were obtained:
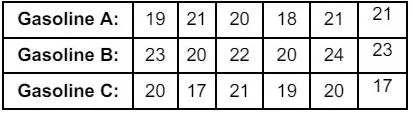
Carry out the Analysis of Variance test and test whether there is significant differences between the average mileage of 3 kinds of gasoline at 5% level of significance.
4(a) A manurial trial with six levels of Farmyard Manure (FYM) was carried out in a randomised block design with 4 replications at the experimental station Junagarh with a new study the rate of decomposition of organic matters in soil and its synthetic capacity in soil on cotton crop. The yield per plot in kg for different levels of FYM and replications is given below:
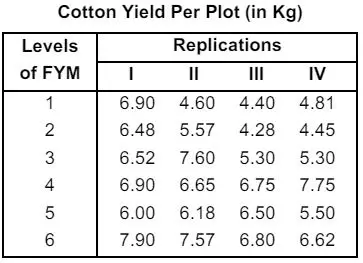
Carry out the Analysis of Variance test and draw the conclusions.
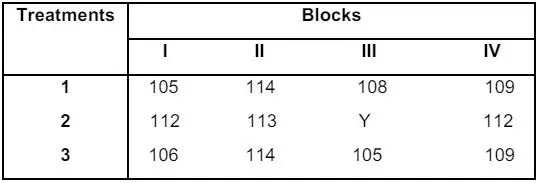
(b) For the given data the yield of the treatment 2 in 3rd block is missing. Estimate the missing value and analyse the data.
5(a) The following data is the data pertaining to a feeding trial on sheep. Treatments
A: Grazing only
B: Grazing + Maize Supplements
C: Grazing + Maize + Protein Supplement P1
D: Grazing + Maize + Protein Supplement P2
E: Grazing + Maize + Protein Supplement P3
Layout and Wool Yield (100 gm) is given as:

Analyse the design with appropriate method and calculate the Critical Difference for the treatment mean yield.
(b) In a class of Statistics, total number of students is 30. Select the linear and circular systematic random samples of 12 students. The age of 30 students is given below:

IGNOU MST-13 (January 2024 – December 2024) Assignment Questions
1. State whether the following statements are true or false and also give the reason in support of your answer:
(a) ![]()
(b) The total number of all possible samples of size 3 without replacement from a population of size 7 is 21.
(c) While analysing the data of a 5 × 5 Latin Square design the d.f. for ESS is equal to 16.
(d) In a Two-way Analysis of Variance test with 5 observations per cell having 4 blocks and 4 treatments the degree of freedom for the total variation is 64.
(e) The probability of selection of a sample of n from the population by SRSWOR is 1/ N.
2(a) A sample of 100 employees is to be drawn from a population of collages A and B. The population means and population mean squares of their monthly wages are given below:
Draw the samples using Proportional and Neyman allocation techniques and compare. Obtain the sample mean and variances for the Proportional Allocation and SRSWOR for the given information. Then Find the percentage gain in precision of variances of sample mean under the Proportional Allocation over the that of SRSWOR.
(b) A population consists of 10 villages with a total of 212 households. The second column of the accompanying table shows the number of households corresponding to each village. Select a PPS with replacement sample of 6 villages by using the Cumulative Total method:
3(a) In a population of size N = 5, the values of the population characteristics are 1, 3, 5, 7, 9, a sample of size 2 is drawn. Verify that ![]() is an unbiased estimate of
is an unbiased estimate of ![]() is equal to
is equal to
(b) In order to compare the mileage yields of 3 kinds of Gasoline, several tests were run, and the following results were obtained:
Carry out the Analysis of Variance test and test whether there is significant differences between the average mileage of 3 kinds of gasoline at 5% level of significance.
4(a) A manurial trial with six levels of Farmyard Manure (FYM) was carried out in a randomised block design with 4 replications at the experimental station Junagarh with a new study the rate of decomposition of organic matters in soil and its synthetic capacity in soil on cotton crop. The yield per plot in kg for different levels of FYM and replications is given below:
Carry out the Analysis of Variance test and draw the conclusions.
(b) For the given data the yield of the treatment 2 in 3rd block is missing. Estimate the missing value and analyse the data.
5(a) The following data is the data pertaining to a feeding trial on sheep. Treatments
A: Grazing only
B: Grazing + Maize Supplements
C: Grazing + Maize + Protein Supplement P1
D: Grazing + Maize + Protein Supplement P2
E: Grazing + Maize + Protein Supplement P3
Layout and Wool Yield (100 gm) is given as:
Analyse the design with appropriate method and calculate the Critical Difference for the treatment mean yield.
(b) In a class of Statistics, total number of students is 30. Select the linear and circular systematic random samples of 12 students. The age of 30 students is given below: